Data Mining berasal dari dua kata yaitu Data yang berarti sekumpulan fakta yang masih kasar dan Mining yang berarti menggali/menambang. Jadi dengan Data Mining diharapkan ada informasi tersembunyi yang bisa digali dari sekumpulan data tersebut. Metode-metode yang digunakan cukup banyak yang mudah-mudahan dapat diulas semua hingga UAS nanti.
Pertemuan kali ini hanya akan membahas sedikit bahasa pemrograman yang cukup mudah yaitu Matlab. Dibandingkan dengan c++, java, dan sejenisnya, Matlab jauh lebih mudah dan cocok jika kita hanya ingin mempelajari metode saja. Sebenarnya banyak alat lainnya seperti Rapidminer atau SQL Server Business Intelligent. Akan tetapi tools tersebut sangat sulit dianalisa struktur kodenya dan tidak cocok untuk pendidikan. Berbeda dengan matlab yang strukture toolbox yang dapat dilihat kode programnya yang dapat kita edit jika hasil algoritmanya kurang memuaskan. Selain itu Matlab dapat digunakan untuk membuat aplikasi yang dapat dijalankan oleh komputer lain yang tidak terinstal Matlab di dalamnya lewat mekanisme kompilasi menjadi executable program.
Here is an example of using GUI Matlab for getting data from excel and plotting it into graph. First open the GUI design, File – New – GUI. Choose the blank GUI and then with two push buttons and a single chart, make the simple GUI here:
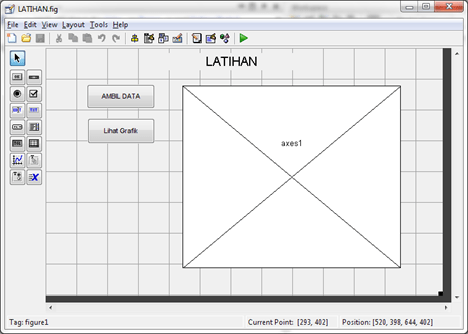
After finishing GUI, save your GUI, so Matlab can generate the code with one m-file. You also can open the m-file editor by type: edit LATIHAN. I save my GUI’s name LATIHAN. We have two files for our application, LATIHAN.m and LATIHAN.fig that represent code and GUI respectively.
Beside edit the “String” on property editor, I suggest you to edit push button 1 and 2 with other name on “Tag” at property editor in order not to have difficult in searching function at m-file editor. Fill the script of function ambil_data and lihat_grafik with this sample code:

Of course you may your function left default option pushbutton1 and 2 . The function uigetfile was typed for calling the GUI for inserting the file. After catching the file (here denote with x), we continue to read that excel file with function xlsread. We have to use two other scripts handles.data and guidata(hObject,handles) because this variable (data) must send to other function (lihat_grafik function). Use your excel to create sample data (two field/column and some lines).
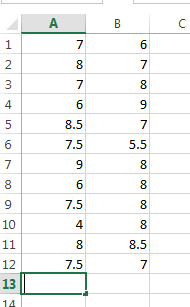
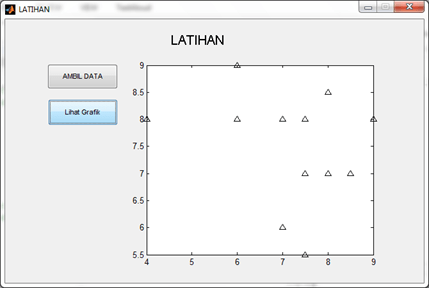
The second function was made for creating graph purpose. We use function plot with x-axis and y-ordinate. x=data(:,1) means creating the x variable contain data from colom 1 of data. If you run the program, you have to get the plot of the data.
This is the end of the introduction to Matlab for data mining session. Next week we’ll learn data mining algorithm : K-nearest Neighbourhood.
