Data Mining/08.04.2013/Sistem Informasi
This week, because I have trouble with my tummy, I cannot teach Fuzzy C-Means (FCM) Clustering. But I will give a simple explanation in this blog. Last week we have learned the hard clustering with K-Means and create a simple application with GUI. For simplicity, we can use that GUI and change the K-Means Method with FCM.
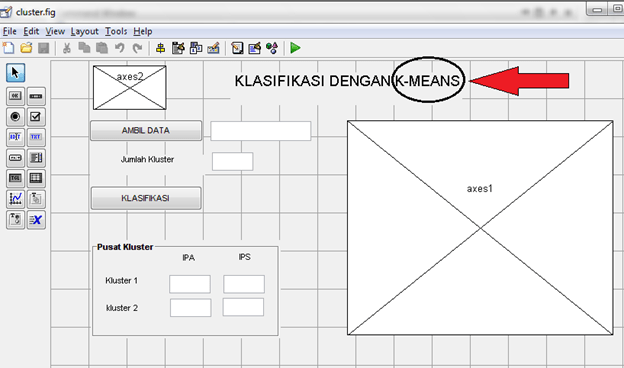
Open your Matlab and change the current directory to your last Matlab Application. Type guide <name_of_application>, or click File – New – GUI and chose tab: Open Existing GUI. Browse your GUI (fig file). This is my own GUI of K-Means application.
After change the title K-Means with FCM, save as your work and give a different name, so we have two application: K-Means and FCM. Go to your m-file and find the function that state about K-Means Clustering. Change it with FCM function. There is a little different about separation of each cluster. For this example, we used two classification (IPA’s and IPS’s). Use the script below for classification function:
- X=handles.X
- k=handles.k
- [C,U]=fcm(X,k)
- set(handles.ipa1,‘String’,C(1,1))
- set(handles.ips1,‘String’,C(1,2))
- set(handles.ipa2,‘String’,C(2,1))
- set(handles.ips2,‘String’,C(2,2))
- index1=find(U(1,:)==max(U))
- index2=find(U(2,:)==max(U))
- axes(handles.axes1)
- line(X(index1, 1), X(index1, 2), ‘linestyle’,…
- ‘none’,‘marker’, ‘o’,‘color’,‘b’);
- line(X(index2,1),X(index2,2),‘linestyle’,…
- ‘none’,‘marker’, ‘^’,‘color’,‘r’);
- hold on
- plot(C(1,1),C(1,2),‘ko’,‘markersize’,11,‘LineWidth’,2)
- plot(C(2,1),C(2,2),‘kx’,‘markersize’,11,‘LineWidth’,2)
- function kluster_Callback(hObject, eventdata, handles)
- hold on
After Running, you have to see the result below. You can separate the data into two cluster (tends to IPA and Tends to IPS):

Now, try to make a code for creating the result in Excel.
