Data Mining/01.04.2013/Sistem Informasi
You can see the explanation: http://en.wikipedia.org/wiki/K-means_clustering. K-means is hard-clustering that different with Fuzzy C-Means that Soft-Clustering.
File – New – GUI. Make a design below.
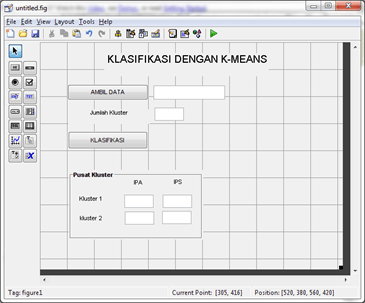
Save yout GUI.
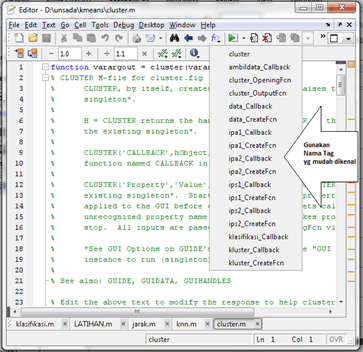
Fill script to function ambildata_Callback:
- data=uigetfile(‘*.xlsx’)
- set(handles.data,‘String’,data)
- X=xlsread(data)
- handles.X=X
- guidata(hObject,handles)
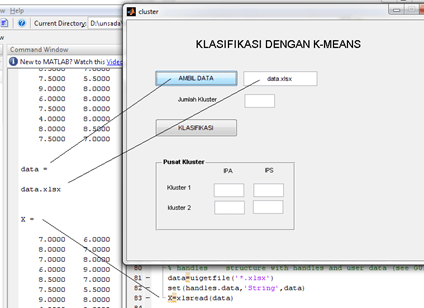
Look at command window to see the result
Script function data_Callback (text box of number of cluster)
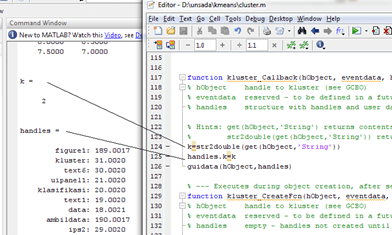
Make sure k and handles.k appear in Command Window.
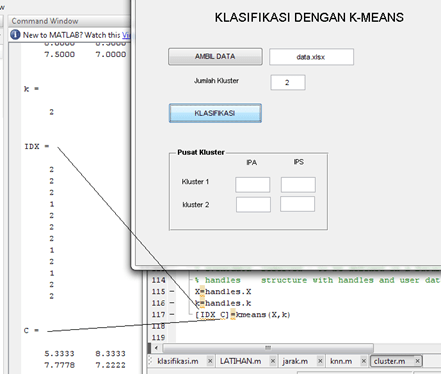
IDX and C the result of kmeans function that state index of every record and center of cluster respectively.
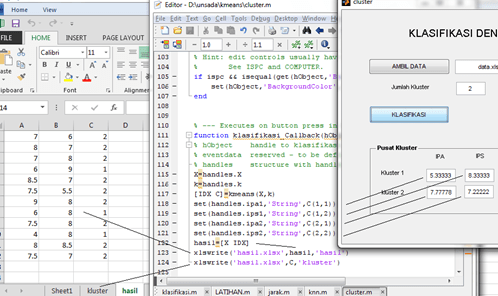
Look at how to create excel file with function xlswrite. There are two sheets: hasil and kluster. Use “set” for sending result to edit text ipa1, ipa2, ips1, and ips2 at GUI.
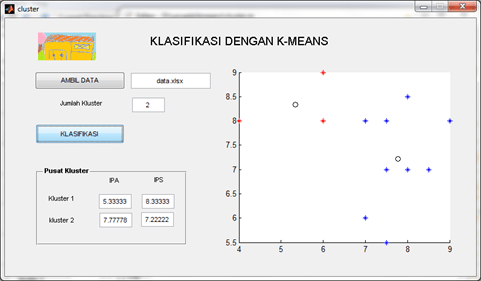
You can add axes to show the result graphically.
- %buat grafik
- ukuran=size(hasil)
- jlhdata=ukuran(1,1)
- axes(handles.axes1)
- hold
- for i=1:jlhdata
- if hasil(i,3)==1
- plot(hasil(i,1),hasil(i,2),‘*r’)
- else
- plot(hasil(i,1),hasil(i,2),‘*b’)
- end
- end
- plot(C(1,1),C(1,2),‘ok’)
- plot(C(2,1),C(2,2),‘ok’)
Next week we’ll discuss Fuzzy C-Means Clustering.
