Pengenalan Pengaturan/30.04.2013/Teknik komputer
Terkadang dibutuhkan grafik yang membandingkan beberapa jenis sistem kendali dalam satu SCOPE. Untuk itu diperlukan Multiplexer (MUX) yang memadukan dua atau lebih keluaran dalam satu SCOPE. Untuk latihan buat contoh Sistem Kendali sebagai berikut.

Multiplexer diperoleh dengan mudah lewat SEARCH di Simulink Library Browser.

Secara Default, MUX menyediakan dua masukan. Ganti “Number of Input” dengan tiga karena kita akan merancang tiga masukan.

Jalankan Model Simulink yang baru saja dibuat. Ketika SCOPE dilihat (dengan cara dobel klik) akan tampak respon perbandingan seperti berikut ini.

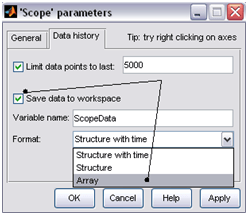
Terkadang kita diminta menampilkan grafik bukan dalam bentuk SCOPE karena kurang nyaman dicetak akibat background yang berwarna gelap. Oleh karena itu kita harus menampilkannya dalam format PLOT yang dapat diedit. Untuk itu pada gambar di atas, tekan Parameters. Pada Tab Data History, check list tombol Save Data to Workspace, dengan format Array. Maksudnya adalah ketika Simulasi berjalan, SCOPE akan menyimpan informasi grafik Workspace. Nama variabel (ScopeData) dapat kita ganti sesuai keinginan.
Berikutnya kita akan membuat PLOT lewat Command Window. Sebelumnya tekan tombol OK terlebih dahulu pada gambar di atas. Jalankan SIMULASI kemudian masuk ke Command Window. Perhatikan, pada Workspace terdapat variabel baru hasil tangkapan SCOPE dengan nama ScopeData. Buat kode berikut ini:
-
plot(ScopeData(:,1),ScopeData(:,2))
-
hold
-
Current plot held
-
-
plot(ScopeData(:,1),ScopeData(:,3))
-
plot(ScopeData(:,1),ScopeData(:,4))
-
grid
Perintah hold bermaksud agar gambar yang lalu tidak dihapus dan tetap dipertahankan ada di figure. Instruksi GRID agar dihasilkan garis bantu pada grafik.


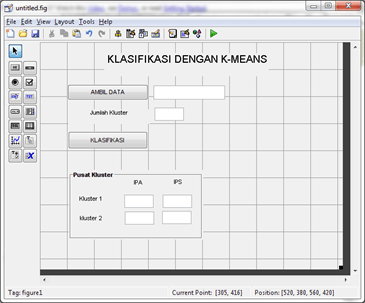

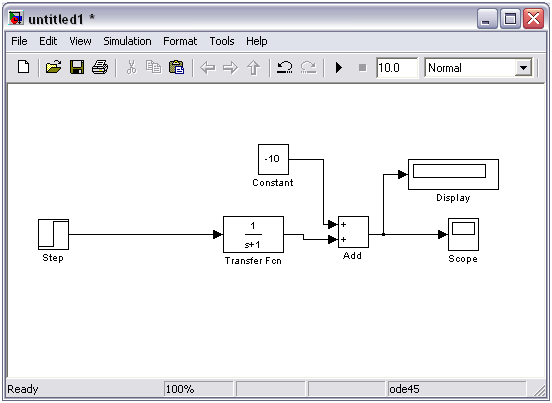
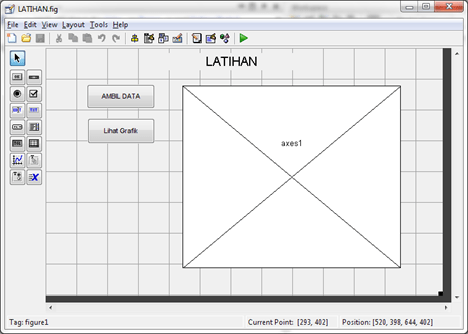
 di Matlab. Tunggu beberapa saat hingga matlab memunculkan jendela simulink. Untuk menggambar diagram blok baru klik icon
  (new) pada jendela Simulink Library browser. Gambar bentuk contoh di bawah ini.
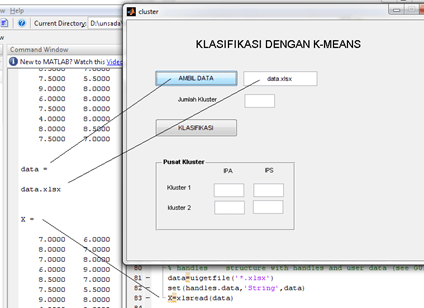
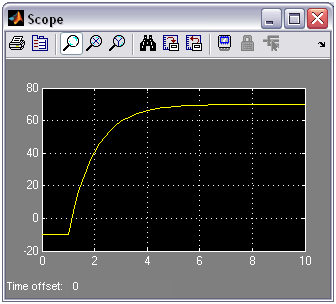
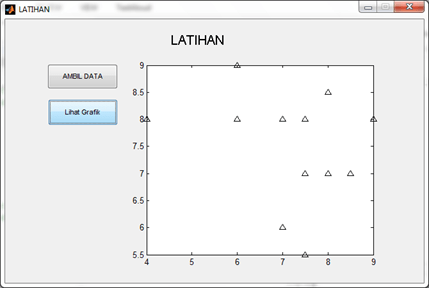
 (run) dan ganti angka di sebelah kanannya sesuai keinginan. Defaulnya adalah 10 detik, Anda bisa mengganti menjadi 100 detik atau lebih sesuai dengan kebutuhan. Hasilnya tampak pada gambar di bawah ini.


