Data Mining/01.04.2013/Sistem Informasi
You can see the explanation: http://en.wikipedia.org/wiki/K-means_clustering. K-means is hard-clustering that different with Fuzzy C-Means that Soft-Clustering.
File – New – GUI. Make a design below.
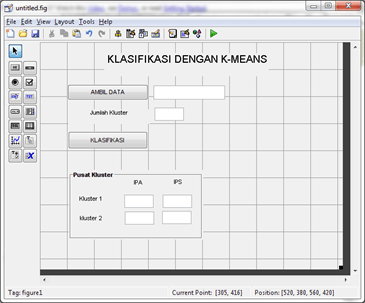
Save yout GUI.
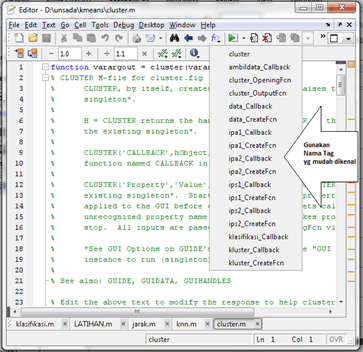
Fill script to function ambildata_Callback:
- data=uigetfile(‘*.xlsx’)
- set(handles.data,‘String’,data)
- X=xlsread(data)
- handles.X=X
- guidata(hObject,handles)
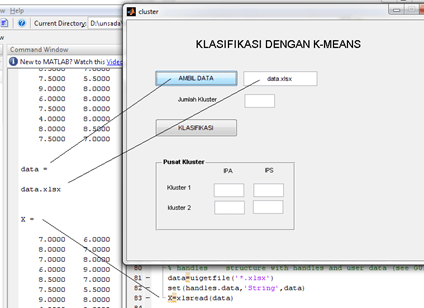
Look at command window to see the result
Script function data_Callback (text box of number of cluster)
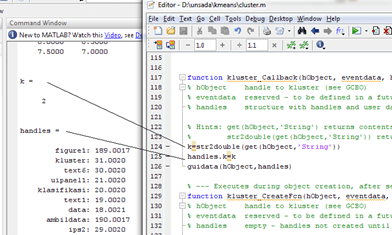
Make sure k and handles.k appear in Command Window.
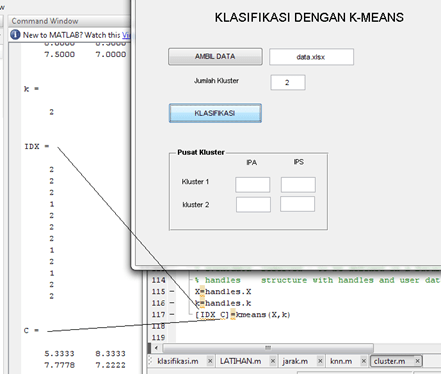
IDX and C the result of kmeans function that state index of every record and center of cluster respectively.
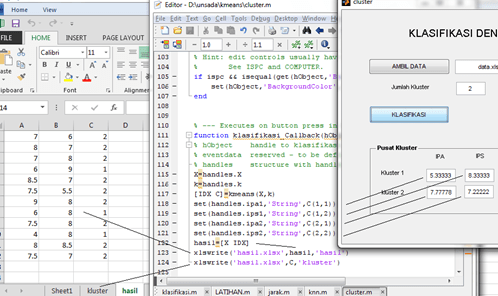
Look at how to create excel file with function xlswrite. There are two sheets: hasil and kluster. Use “set” for sending result to edit text ipa1, ipa2, ips1, and ips2 at GUI.
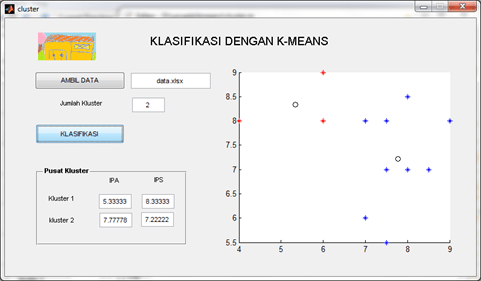
You can add axes to show the result graphically.
- %buat grafik
- ukuran=size(hasil)
- jlhdata=ukuran(1,1)
- axes(handles.axes1)
- hold
- for i=1:jlhdata
- if hasil(i,3)==1
- plot(hasil(i,1),hasil(i,2),‘*r’)
- else
- plot(hasil(i,1),hasil(i,2),‘*b’)
- end
- end
- plot(C(1,1),C(1,2),‘ok’)
- plot(C(2,1),C(2,2),‘ok’)
Next week we’ll discuss Fuzzy C-Means Clustering.

Pak, saya mau bertanya
Kalau untuk code program “buat grafik” itu ditaruhnya dimana ya Pak? Soalnya saya baru berhasil mempraktikkan sampai data hasil kesimpan.
Terimakasih sebelumnya
Pak Saya boleh minta source codenya buat referensi tugas pak, Email Saya Arlinstmik@yahoo.com
saya sendiri udah ga tau ke mana itu file. kayaknya itu ada di buku:http://biobses.com/judul-buku,343-penerapan_data_maining_dengan_matlab.html
engak bisa didownload
assalamualaikum wr wb
selamat sore pak. saya minta izin untuk memakai source code yang sdh dishare di website bapak ya pak?
terimakasih
Kurnia AC, Dosen Polindra
ok