This is an example to create a region drawing from ArcView/ArcGis. Open the ArcView and do these steps:

Because we will draw a region, we will use polygon as a basis of our theme. The window will be appeared everytime we create new theme.

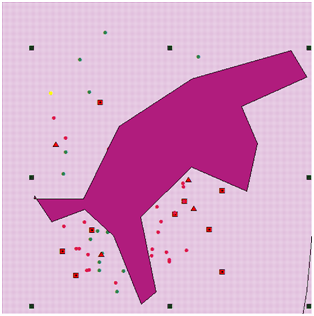
After clicking “OK” you must save and give the name for this new region, e.g “boundaryshp”. Now we start a new boundary polygon as a constraint of our Multiobjective Evolutionary Algorithms (MOEAs). For example we draw the region like figure in dark red color below:
Then we export it to matlab (of course in matlab we say read/impor). Use this script in command window to read the boundary region. But, firstly we have to save.
- data=shaperead(‘boundaryshp.shp’)
This will retrieve a shapefile. But we have to mine the coordinates, using:
- y=data.Y;
- x=data.X;
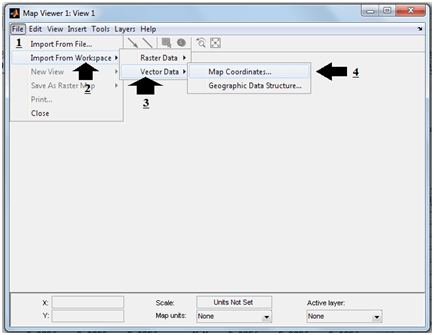
You can use mapviewer to open that region in Matlab. Import from workspace after mapviewer appear.
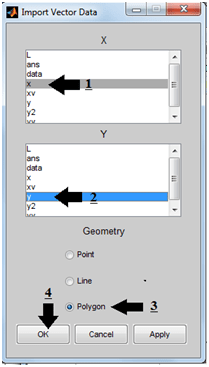
You have to select X and Y coordinates. In our example y and x.
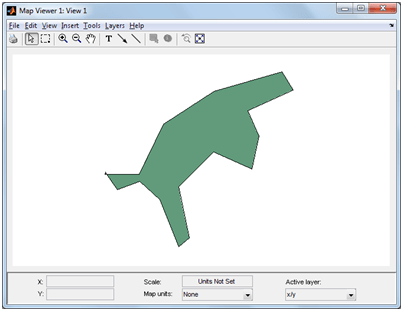
If you do not find any problems, your region will appear like this … meauwww !!
So, we’ve just believed that our spatial data was exported to matlab workspace. The last part is convert the spatial data into coordinates according to our requirements. As an information, the shapefile have row-based style, so we have to transpose them.
-
y=transpose([data.X;data.Y]);
-
y
-
y =
-
1.0e+006 *
-
0.7192 9.3096
-
0.7194 9.3096
-
0.7196 9.3099
-
0.7199 9.3102
-
0.7204 9.3103
-
0.7205 9.3102
-
0.7202 9.3100
-
0.7202 9.3099
-
0.7202 9.3096
-
0.7199 9.3098
-
0.7197 9.3095
-
0.7198 9.3092
-
0.7197 9.3091
-
0.7196 9.3094
-
0.7194 9.3096
-
0.7193 9.3095
-
0.7192 9.3096
-
NaN NaN
-
0.7192 9.3096
-
0.7192 9.3096
-
0.7192 9.3096
-
0.7192 9.3096
-
NaN NaN
Note: May be I rather bad in creating some region, there are two NaN that actually only one pair. It must be there are two closed region on that shapefile.
